CAT1998 Related Question Answers
3.
The following table gives the quantities of apples (in tonnes) arriving at New Delhi market from various states in a particular year. The month in which demand was more than supply, the additional demand was met by the stock from cold storage. 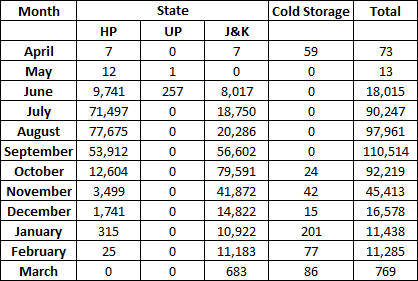 What was the maximum percentage of apples supplied by any state in any of the months?
7. If the yield per tree was 40 kg, then from how many trees were the apples supplied to New Delhi (in millions) during the year?
8. Using the data in the earlier question, if there were 250 trees per hectare, then how many hectares of land was used?
9.
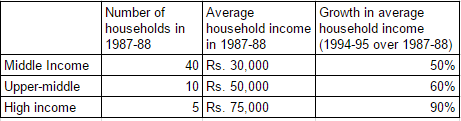
Answer the questions based on the following information. The following bar chart gives the growth percentage in the number of households in the middle, upper-middle and high-income categories in the four regions for the period between 1987-88 and 1994-95. 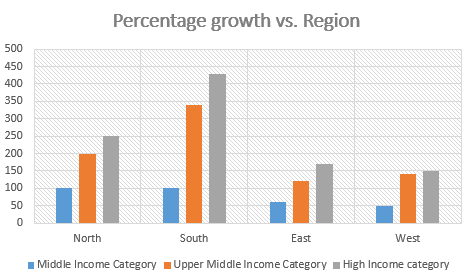
 (Number of households in thousands)Which region showed the highest percentage growth in number of households in all the income categories for the period?
11. What is the percentage increase in total number of households for the northern region (upper-middle class) over the given period?
13. The ratio of total income for the high-income category to the upper-middle class increased by how much percentage in the given period (approximately) ?
15.
Answer the questions based on the following information.Krishna distributed 10-acre land to Gopal and Ram who paid him the total amount in the ratio 2 : 3. Gopal invested a further Rs. 2 lakh in the land and planted coconut and lemon trees in the ratio 5 : 1 on equal areas of land. There were a total of 100 lemon trees. The cost of one coconut was Rs. 5. The crop took 7 years to mature and when the crop was reaped in 1997, the total revenue generated was 25% of the total amount put in by Gopal and Ram together. The revenue generated from the coconut and lemon trees was in the ratio 3 : 2 and it was shared equally by Gopal and Ram as the initial amount spent by them were equal.What was the total output of coconuts?
19. What was the ratio of yields per acre of land for coconuts and lemons (in terms of number of lemons and coconuts)?
20.
Answer the questions based on the following information.Ghosh Babu has a manufacturing unit. The following graph gives the cost for the various number of units. Given: Profit = Revenue – Variable cost – Fixed cost. The fixed cost remains constant up to 34 units after which additional investment is to be done in fixed assets. In any case, production cannot exceed 50 units. Note: The fixed cost for less than 34 units is 50 and the the fixed cost for more is 100.
The revenu from 50 units is 1000 and the variable cost from 50 units is 700What is the minimum number of units that need to be produced to make sure that there was no loss?
Note: The fixed cost for less than 34 units is 50 and the the fixed cost for more is 100.
The revenu from 50 units is 1000 and the variable cost from 50 units is 700What is the minimum number of units that need to be produced to make sure that there was no loss?
21. What is the least number of units that should be manufactured such that the profit was at least Rs. 50?
22. If at the most 40 units can be manufactured, then what is the number of units that can be manufactured to maximise profit per unit?
23. If the production cannot exceed 45 units, then what is the number of units that can maximise profit per unit?
24. If the fixed cost of production goes up by Rs. 40, then what is the minimum number of units that need to be manufactured to make sure that there is no loss?
25.
Answer the questions based on the following information. In the following chart, the price of logs shown is per cubic metre that of plywood and saw timber is per tonne.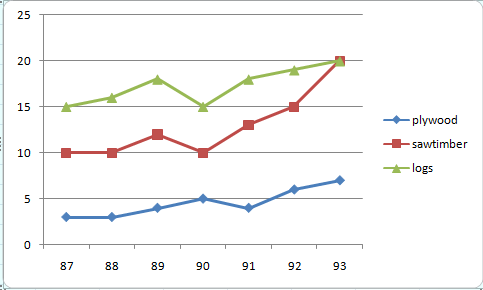 What is the maximum percentage increase in price per cubic metre or per tonne over the previous year?
 Powered By:Omega Web Solutions
© 2002-2017 Omega Education PVT LTD...Privacy | Terms And Conditions